If you’ve been in the community for long enough, you’ve probably heard me talk about my graphing calculator. Made on GKC day 6, most people consider it to be magic, but in this guide I’m going to break down how I made it, and how you can made it too. And for reference, the finished graphing calculator can be found here. This guide isn’t going to contain step by step instructions, since if it did it would take me a month to write. Instead, I’m going to explain how the graphing calculator works, and hopefully you’ll learn enough to recreate it.
Where do you even start?
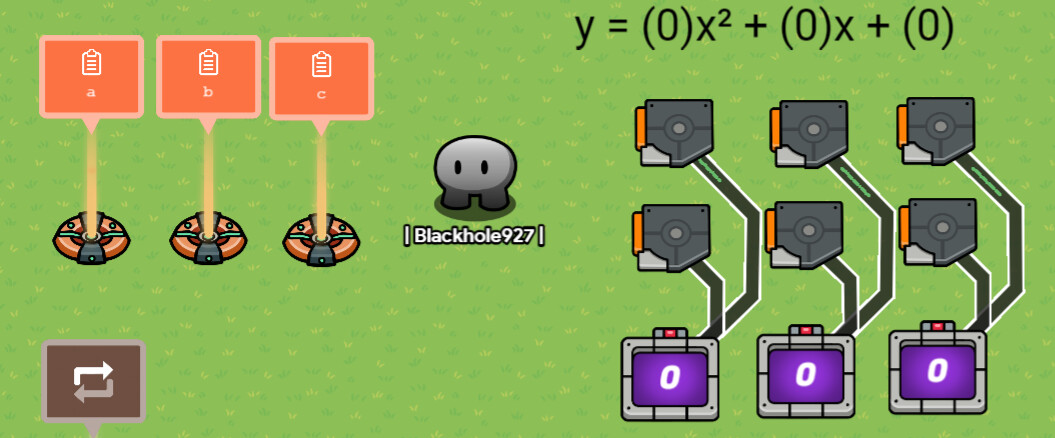
Well, we need something to graph. I used three properties, a, b and c, to store the function I was graphing: ax² + bx + c. I then set up some triggers that increased and decreased each property, so the player could adjust what was being graphed in game. I used counters, and had the counters update the properties with their value. Here is the final input system:
The display design
Displaying images in gimkit is pretty tricky. The method I used was pretty similar to this pixel art guide by bluebear. However, instead of making my pixel art in google docs, I generated it on the spot with block code. Each column of the display was a text object, and contained the following code:
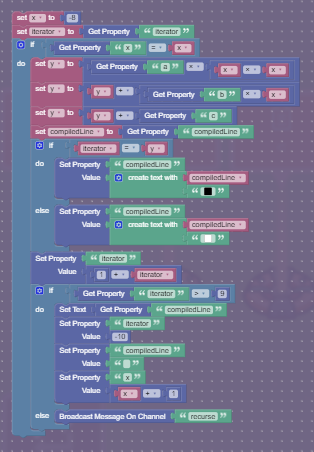
There are two big properties- iterator and x. The x property holds the x value of the column being graphed, and the iterator property holds the value of the y pixel being graphed.
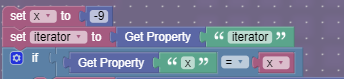
This code starts by storing the x value of the column and the iterator (y value) in two variables. It then checks if the x value being graphed is the x value of this column. If so, it starts the process of graphing the column.
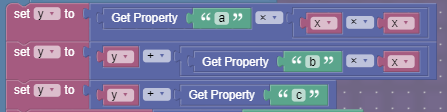
It first finds the pixel that needs to be graphed, by plugging in the a, b, c, and d properties into ax^2+bx+c.
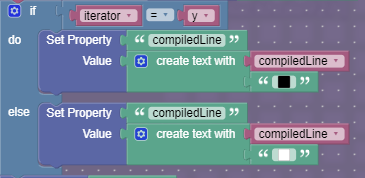
It then gets the property compiledLine. This is where the emoji’s that are being rendered are stored before they are displayed.
![]()
Now, the code figures out whether the current pixel should be on or off. It checks if the y value that we calculated earlier is the same as the y value we are currently finding the pixel for. If it is, we append a black pixel to the compiledLine property, otherwise we append a white pixel.
To now graph the next pixel, iterator is increased by one.

Before everything is done, the code checks if this column is done being graphed, by checking if the y coordinate being graphed (iterator) is greater than 9. If the graphing for the column is done, the text is set to compiledLine, the value of compiledLine is reset to nothing, the iterator (y value being graphed) is set to -10, and the x is increased by 1.
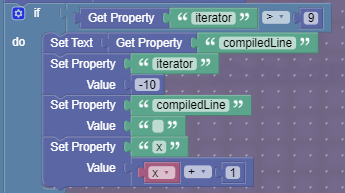
Finally, we recurse to either graph the next vertical pixel or the next column.
![]()
Limits
Well, that wasn’t that complex was it? The algorithm the graphing calculator uses to graph is quite simple, but actually implementing it can be a nightmare. All of my code had to be less than 75 blocks to fit under the block limit, and bypassing the block limit by adding extra recursion would have slowed the calculator down to a state of unusability. Also, the larger the display, the more gimkit will lag, since gimkit wasn’t ever made to run a graphing calculator.
Conclusion
And that’s all! The graphing calculator isn’t complex because it is a graphing calculator, it’s complex because it has to cram a lot of code into not much space. I hope you learned something, and maybe now you can make your own graphing calculator ![]()